The male-female sleep divide – according to our data
We spend around a third of our lives asleep – but how much do we know about how our sleeping habits compare to others?
Thanks to Our Future Health participants, we’ve been able to compare the sleep habits of almost 2 million people.
It’s one of the largest ever analyses of sleep conducted in the UK – and it reveals differences depending on sex, age, and even income.
The surprising difference between men and women
While everyone needs different amounts of sleep, the NHS says that most adults need 7-9 hours of sleep per night on average. Habitually sleeping too little, or too much, is associated with higher risks of common diseases, including type 2 diabetes and cardiovascular disease.
When we analysed self-reported data from 1,978,713 participants’ health and lifestyle questionnaires, we found that 73.0% of men and 70.6% of women say they sleep 7-9 hours in every 24 hours. More people slept less than 7 hours (24.1% of men and 25.8% of women) than those who slept more than 9 hours (1.5% of men and 2.2% of women).
So far, so similar. However, the habits of men and women start to diverge when you chart the amount of sleep they get by age.
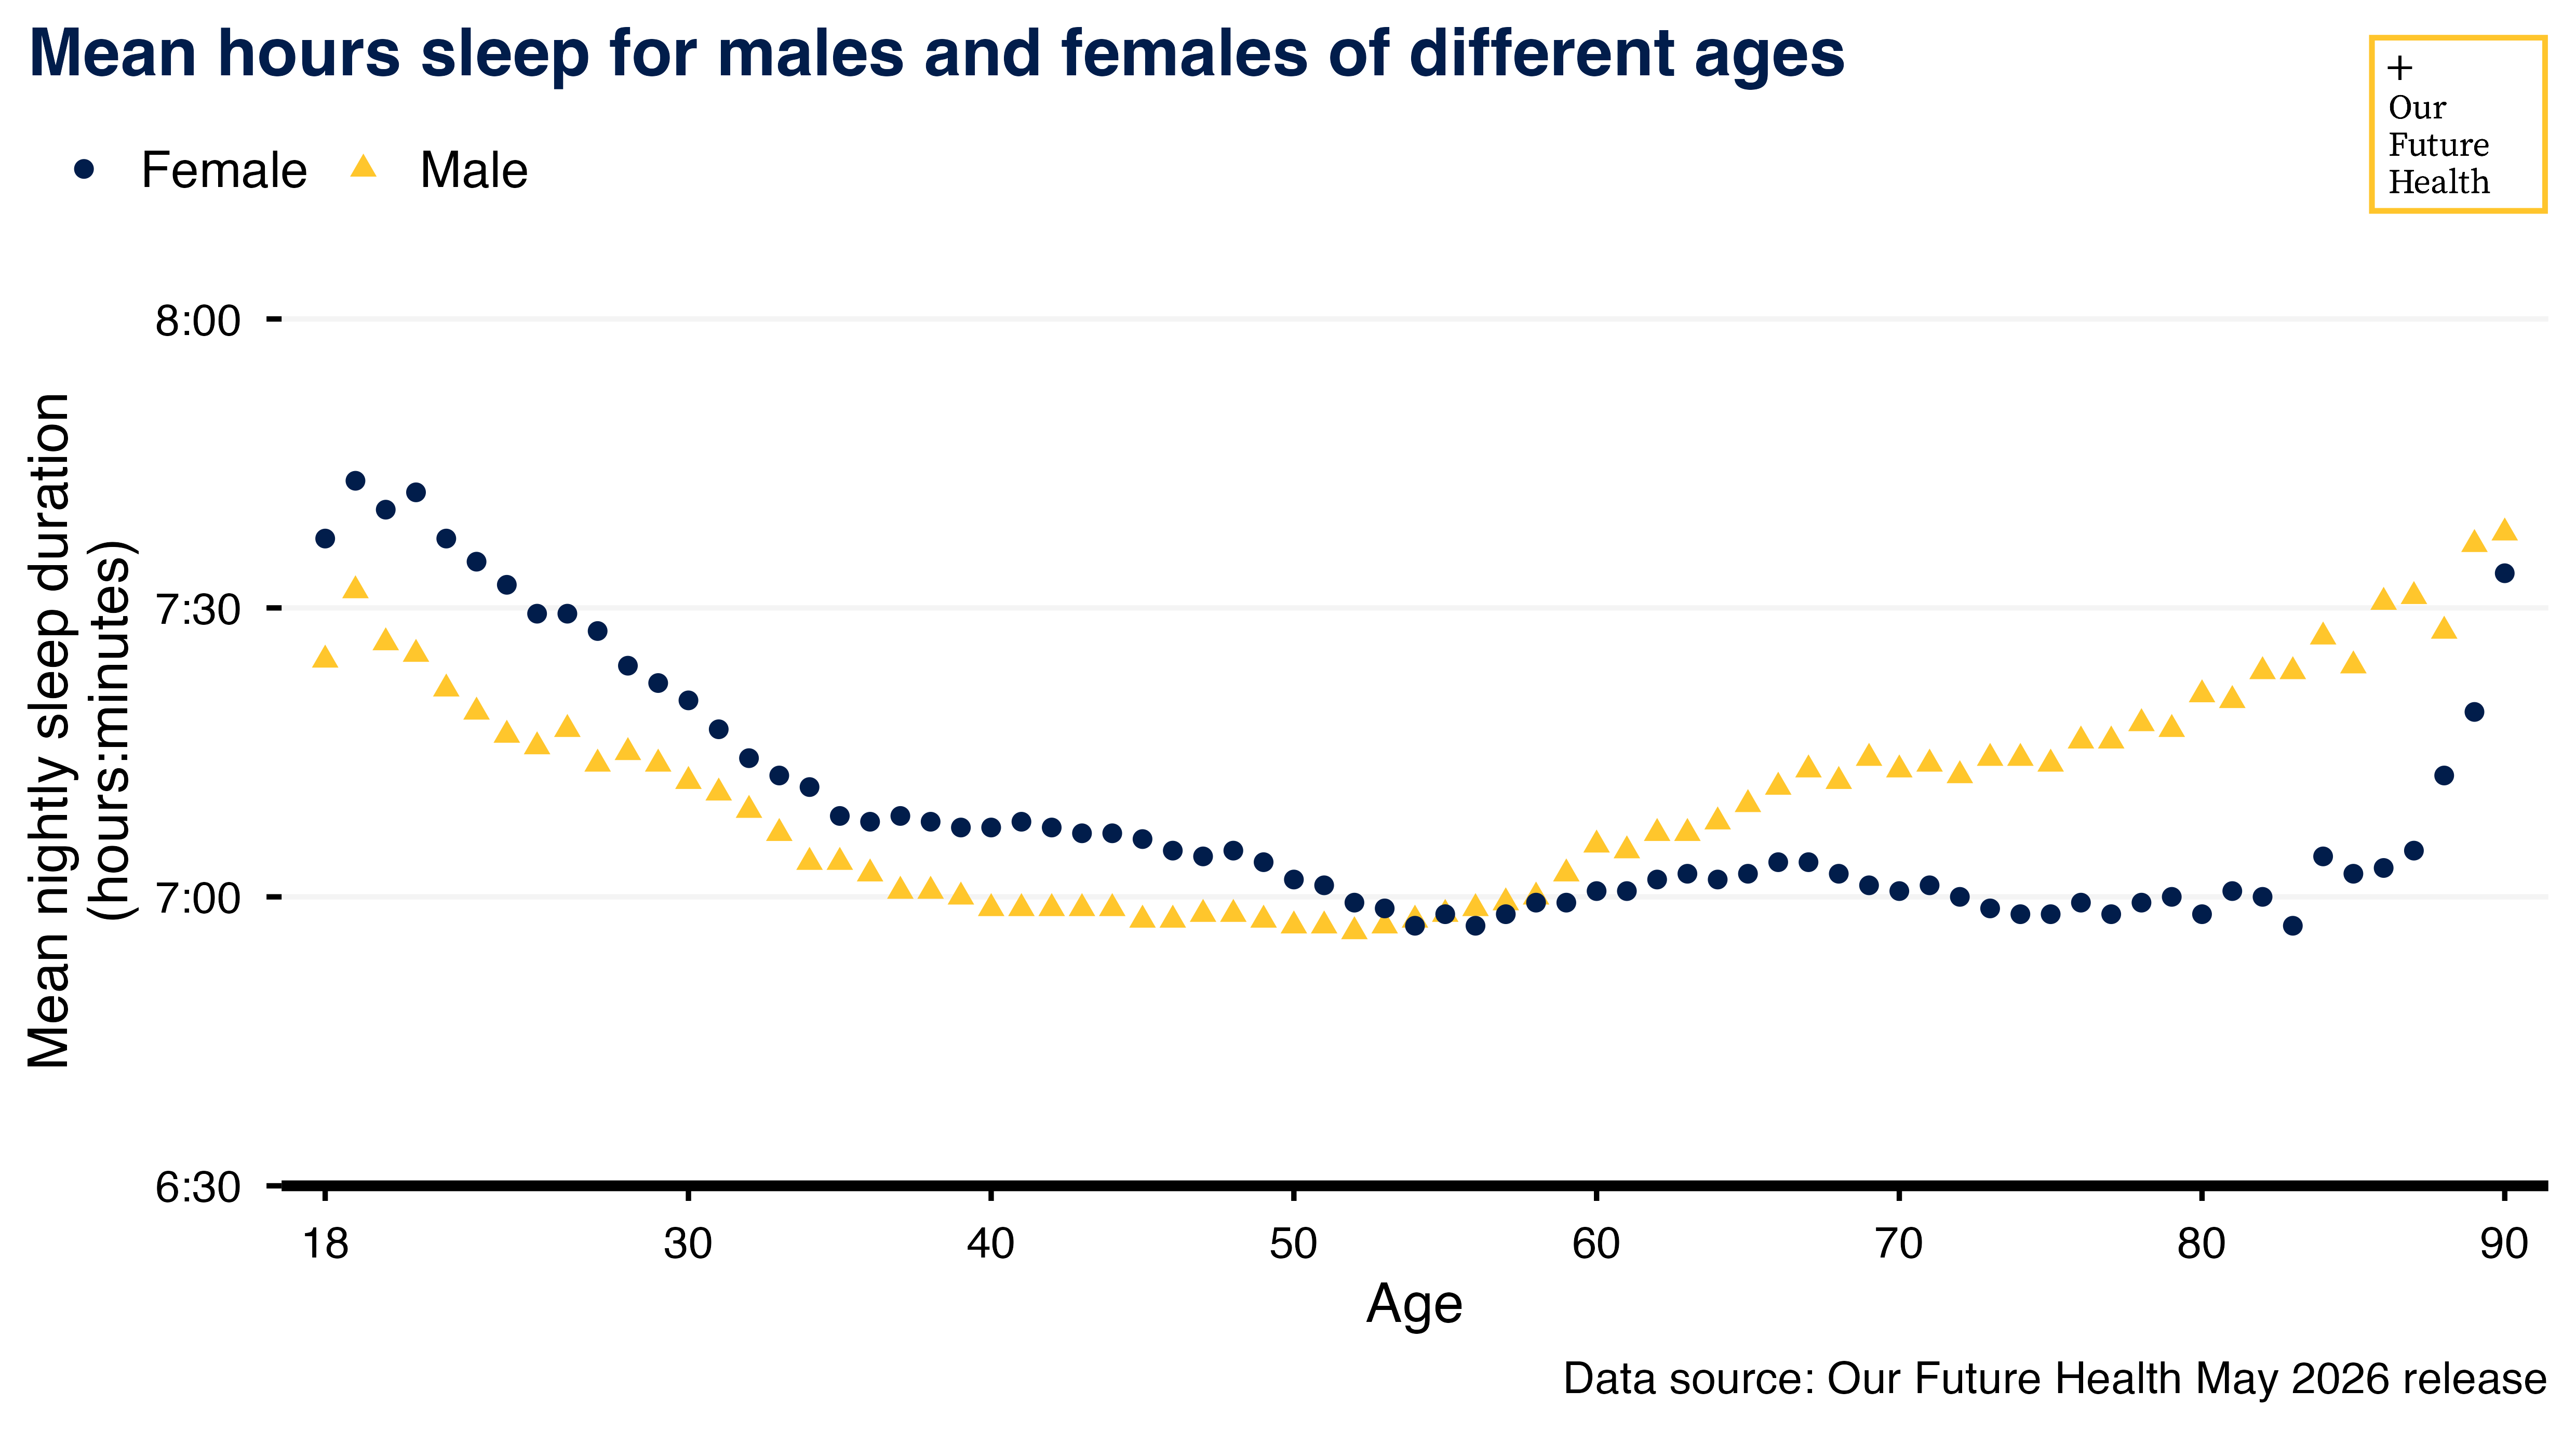
Participants in their late teens and 20s report the most sleep on average. Those in their 30s and 40s report progressively less, with the lowest average among people in their early 50s (just under 7 hours in every 24 hours).
While women under the age of 50 sleep more than men the same age, the pattern reverses from the mid-50s onwards.
Among older participants, men’s average reported sleep duration generally increases, exceeding 7.5 hours in their late 80s. In contrast, women’s average sleep duration remains relatively constant. 55-year-old women and 75-year-old women are getting the same amount of sleep on average (6 hours 58 minutes). 85-year-old women report a similar amount (7 hours 2 minutes).
The snoring and snoozing divide
As well as reporting the number of hours they sleep across 24 hours, our participants also answer questions about snoring and napping.
Their data highlights further differences between the habits of men and women.
Men are more likely than women to report receiving complaints about their snoring. 38.7% of men say they receive complaints, compared with 23.6% of women.
Men are also more likely to nap during the day than women. 43.7% of men say they nap “sometimes” or “usually”, compared with 36.1% of women.
When we break the data down by age groups, we see that men are more likely to nap than women from the age of 40-49 upwards.

Income and sleep
We also analysed the data according to income, geographical region, and ethnicity.
Participants from higher-income households report getting more sleep. Those with annual household incomes above £100,000 report an average of 7 hours 14 minutes, compared with 7 hours 3 minutes among those earning £18,000–£30,999.
However, it’s worth noting that the variation here is small, with approximately 10 minutes difference between the highest and lowest groups.

Geography and sleep
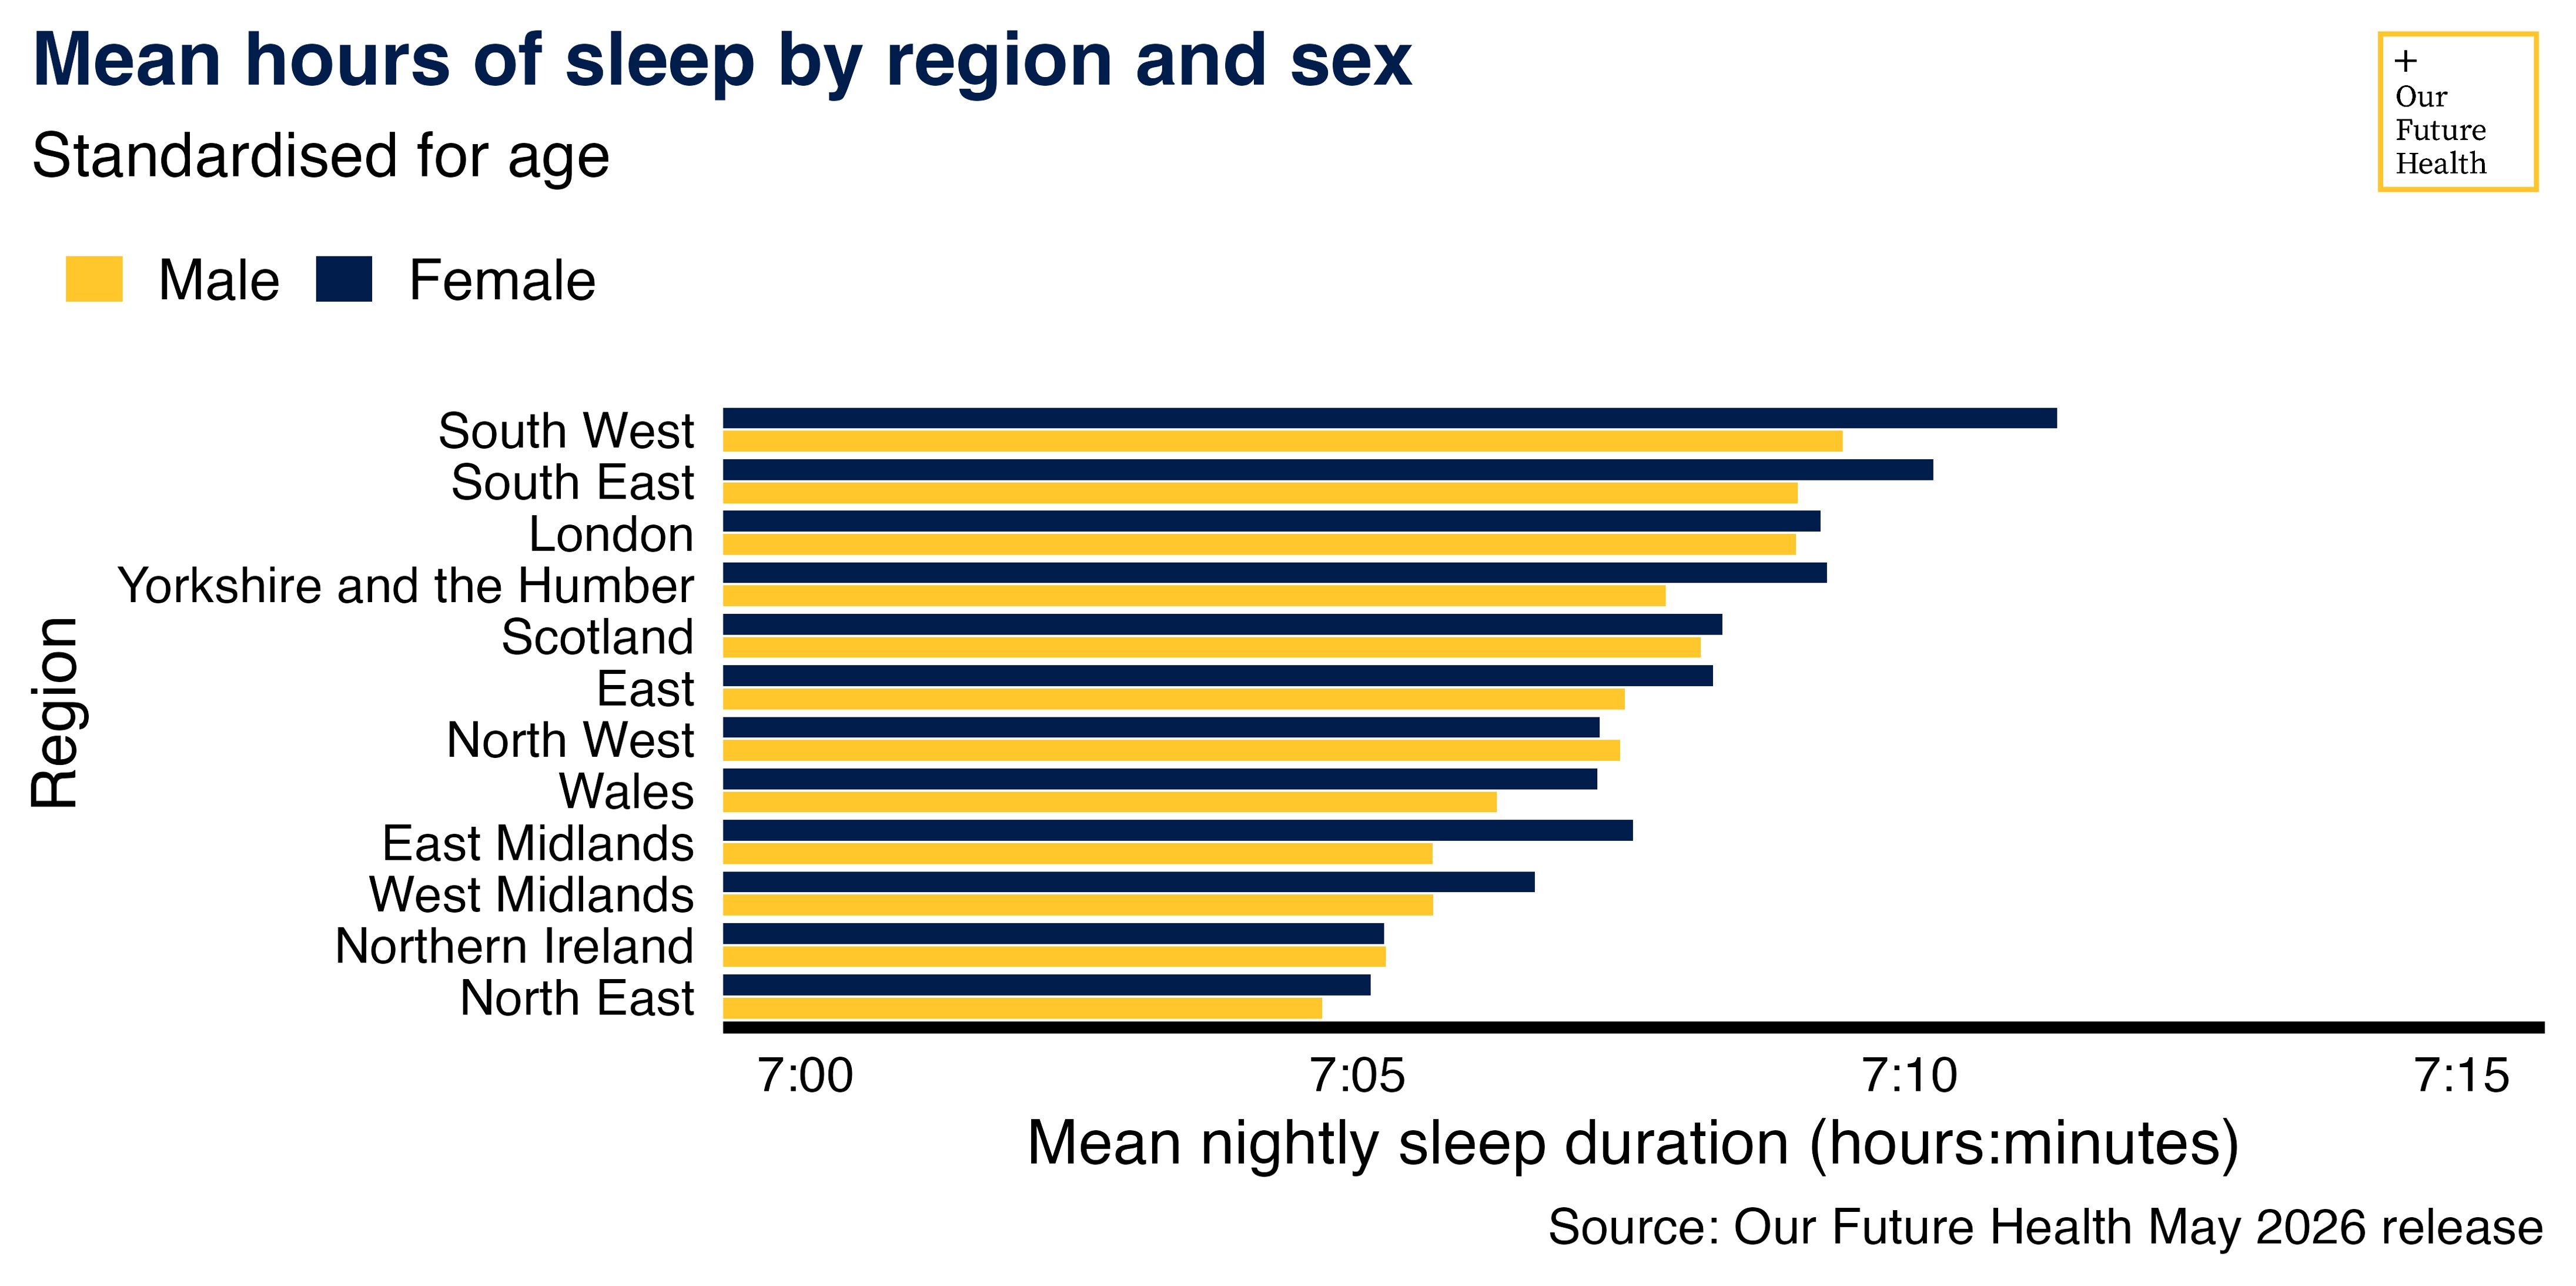
Similarly small variations can be seen between different regions of the UK. On average, participants in the South West sleep the most, while those in the North East sleep the least – but the difference is only 6-7 minutes.
Ethnicity and sleep
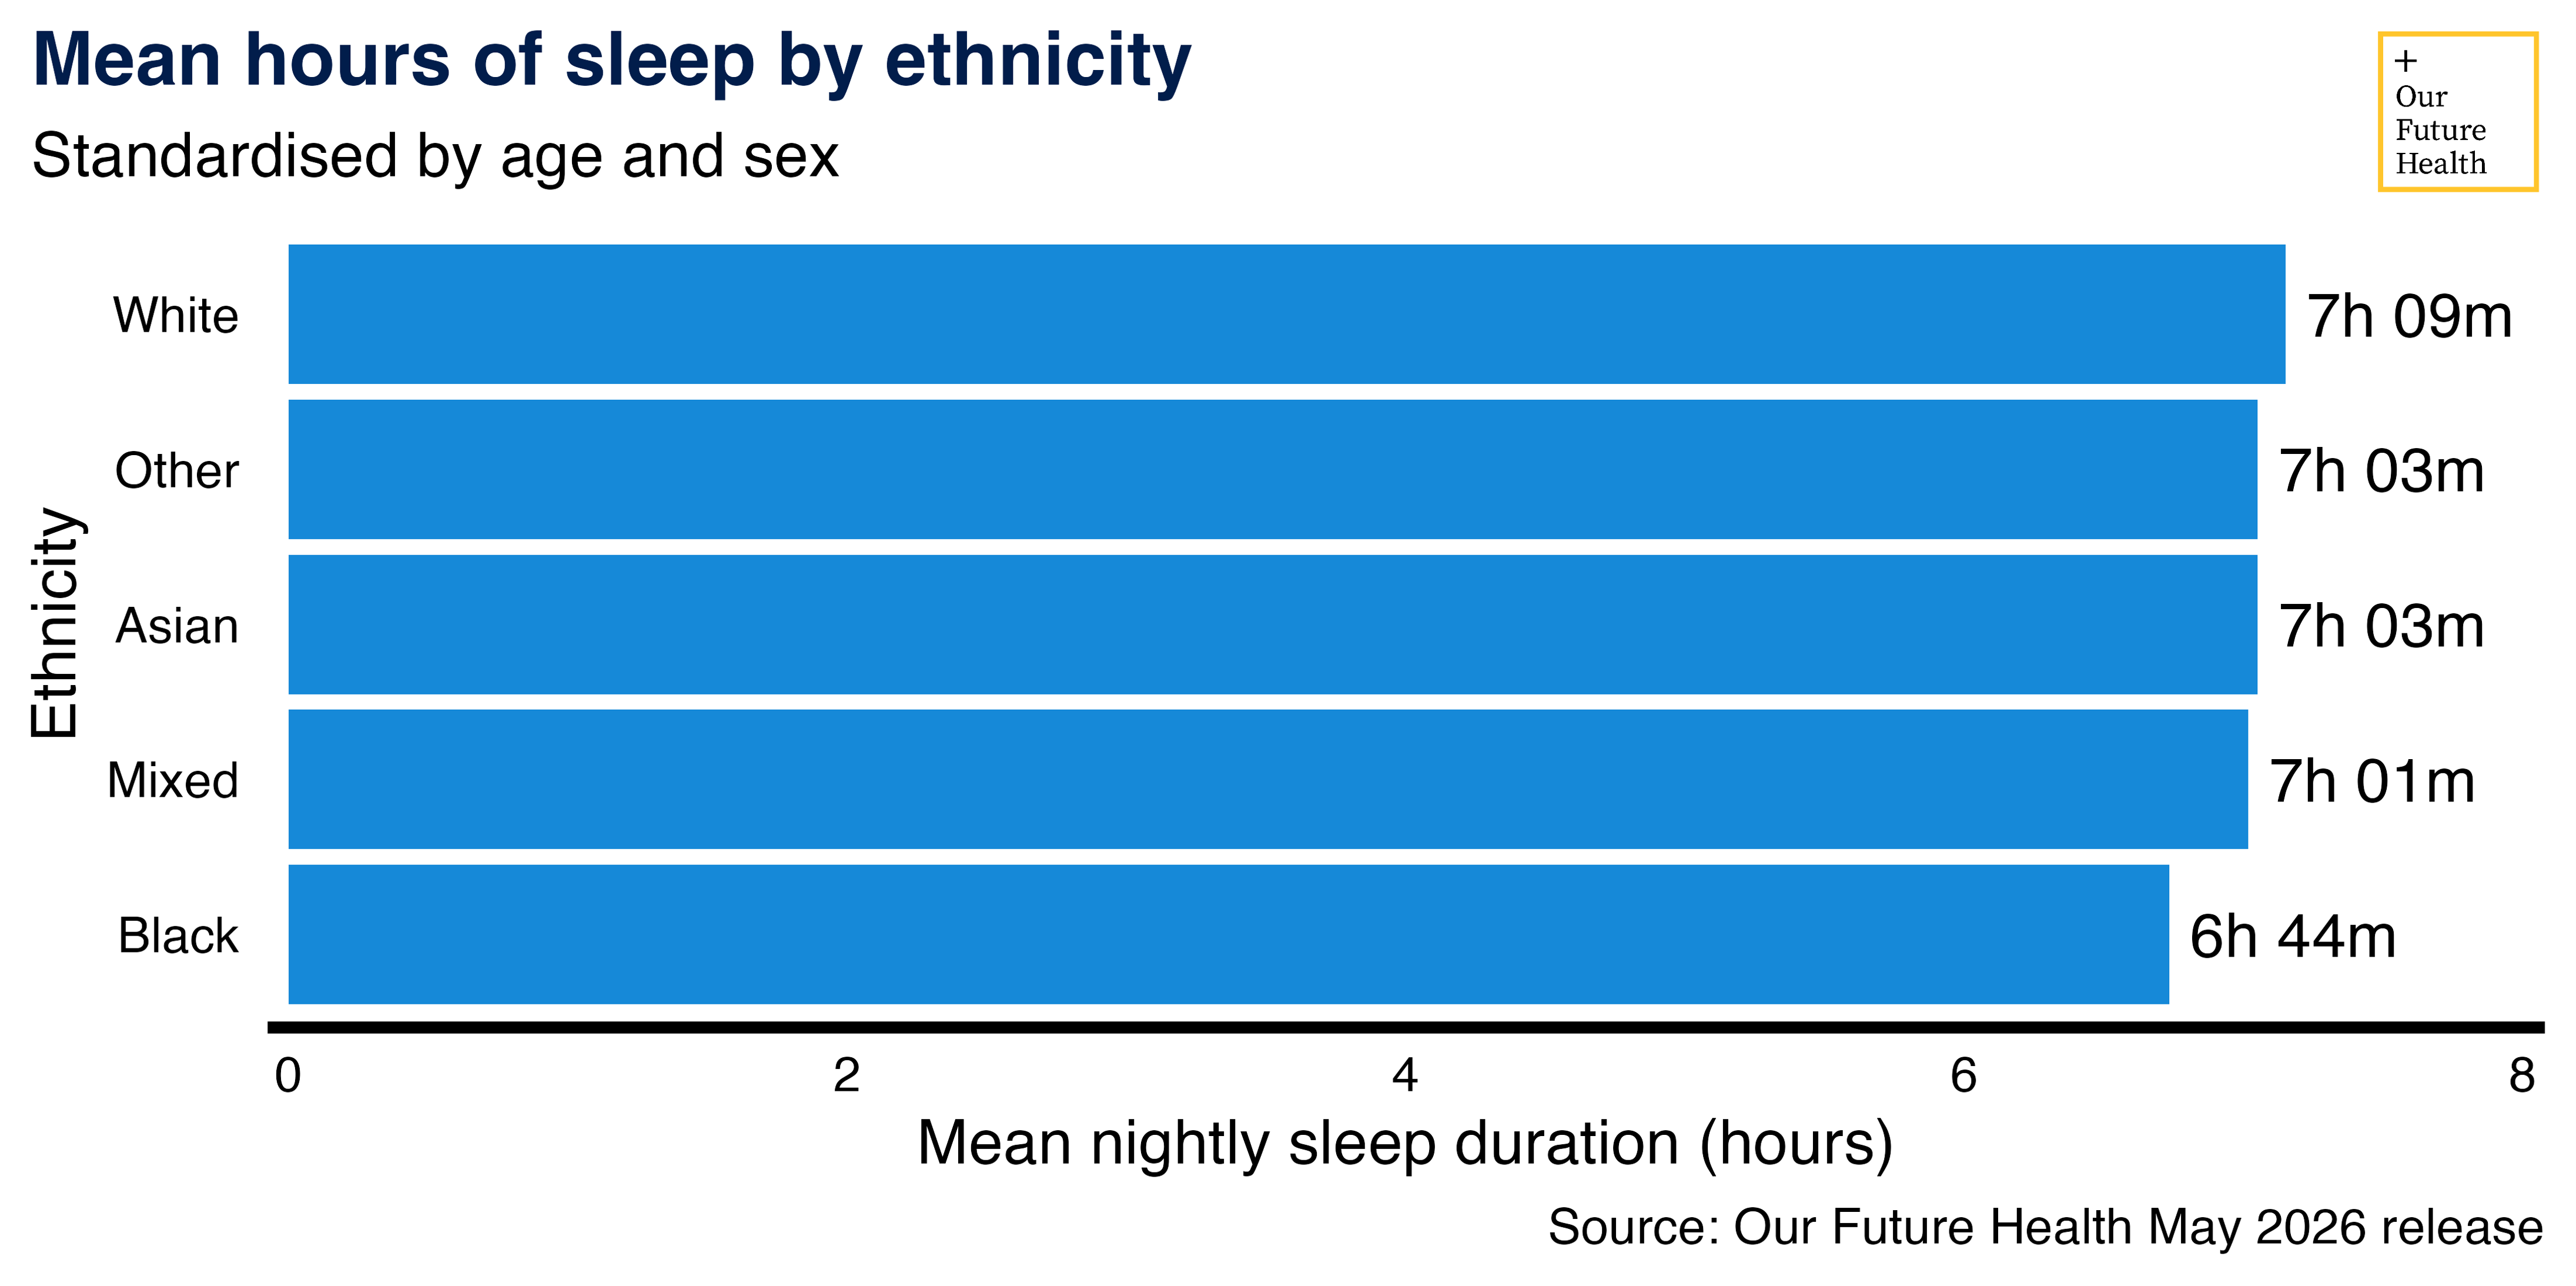
When we analyse the data by ethnicity, a more pronounced trend emerges. Black participants report sleeping the least (6 hours 44 minutes in every 24 hours), while White participants report the most (7 hours 9 minutes). That equates to approximately 25 minutes difference.
Get advice on improving your sleep
Do you struggle to sleep? The NHS offers online advice, including how to improve your sleep hygiene – the small habits and routines associated with how you sleep. The page also includes support for insomnia.
Some of our partner charities also offer sleep support tailored around specific diseases, including Parkinson’s UK, Asthma + Lung UK, Alzheimer’s Society, and Action for ME.
How researchers are using our sleep data
Our participants’ data is already being used by researchers who are interested in the health effects of sleep.
For example:
- Researchers at the University of Edinburgh are investigating how lifestyle factors including sleep contribute to physical health problems.
- Researchers at the University of Manchester are looking into the risk of asthma in night shift workers. They hope to find out whether biological sex and body clock play a role in the condition.
You can see all the research studies that are currently analysing our participants’ data on the Health Data Research Gateway.
Data tables
Percentage of Our Future Health participants getting more or less than the recommended 7-9 hours sleep per night, by region
| <7 hours | 7-9 hours | >9 hours | ||||
| % Females | % Males | % Females | % Males | % Females | % Males | |
| South West | 24.2 | 22.6 | 73.5 | 76.1 | 2.3 | 1.3 |
| South East | 24.4 | 22.8 | 73.6 | 75.8 | 2.0 | 1.4 |
| London | 23.8 | 22.3 | 74.4 | 76.4 | 1.7 | 1.3 |
| Wales | 28.1 | 25.8 | 69.0 | 72.4 | 2.9 | 1.7 |
| West Midlands | 27.7 | 25.8 | 70.0 | 72.6 | 2.3 | 1.6 |
| East Midlands | 27.1 | 25.9 | 70.7 | 72.4 | 2.2 | 1.6 |
| East | 25.6 | 24.4 | 72.1 | 74.1 | 2.1 | 1.5 |
| Northern Ireland | 28.6 | 25.7 | 68.3 | 72.7 | 3.0 | 1.6 |
| North West | 27.1 | 24.9 | 70.6 | 73.4 | 2.3 | 1.7 |
| Yorkshire and the Humber | 26.1 | 25.0 | 71.4 | 73.2 | 2.5 | 1.8 |
| North East | 29.1 | 27.2 | 68.3 | 71.0 | 2.6 | 1.8 |
| Scotland | 27.0 | 25.0 | 70.5 | 73.0 | 2.5 | 2.0 |
Mean sleep duration in hours by income
| Income in £ | Mean sleep duration in hours |
| <18k | 7h 4m |
| 18k-30999 | 7h 3m |
| 31k-51999 | 7h 7m |
| 52k-100k | 7h 10m |
| >100k | 7h 14m |
Mean sleep duration in hours by ethnicity
| Ethnicity | Mean sleep duration in hours |
| White | 7h 9m |
| Asian | 7h 3m |
| Mixed | 7h 1m |
| Other | 7h 3m |
| Black | 6h 44m |
Mean hours sleep by age and sex
| Age | Female | Male |
| 18 | 7h 37m | 7h 25m |
| 19 | 7h 43m | 7h 32m |
| 20 | 7h 40m | 7h 26m |
| 21 | 7h 42m | 7h 25m |
| 22 | 7h 37m | 7h 22m |
| 23 | 7h 35m | 7h 19m |
| 24 | 7h 32m | 7h 17m |
| 25 | 7h 29m | 7h 16m |
| 26 | 7h 29m | 7h 17m |
| 27 | 7h 28m | 7h 14m |
| 28 | 7h 24m | 7h 15m |
| 29 | 7h 22m | 7h 14m |
| 30 | 7h 20m | 7h 12m |
| 31 | 7h 17m | 7h 11m |
| 32 | 7h 14m | 7h 09m |
| 33 | 7h 13m | 7h 07m |
| 34 | 7h 11m | 7h 04m |
| 35 | 7h 08m | 7h 04m |
| 36 | 7h 08m | 7h 02m |
| 37 | 7h 08m | 7h 01m |
| 38 | 7h 08m | 7h 01m |
| 39 | 7h 07m | 7h 00m |
| 40 | 7h 07m | 6h 59m |
| 41 | 7h 08m | 6h 59m |
| 42 | 7h 07m | 6h 59m |
| 43 | 7h 07m | 6h 59m |
| 44 | 7h 07m | 6h 59m |
| 45 | 7h 06m | 6h 58m |
| 46 | 7h 05m | 6h 58m |
| 47 | 7h 04m | 6h 58m |
| 48 | 7h 05m | 6h 58m |
| 49 | 7h 04m | 6h 58m |
| 50 | 7h 02m | 6h 57m |
| 51 | 7h 01m | 6h 57m |
| 52 | 6h 59m | 6h 56m |
| 53 | 6h 59m | 6h 57m |
| 54 | 6h 57m | 6h 58m |
| 55 | 6h 58m | 6h 58m |
| 56 | 6h 57m | 6h 59m |
| 57 | 6h 58m | 6h 59m |
| 58 | 6h 59m | 7h 00m |
| 59 | 6h 59m | 7h 02m |
| 60 | 7h 01m | 7h 05m |
| 61 | 7h 01m | 7h 05m |
| 62 | 7h 02m | 7h 07m |
| 63 | 7h 02m | 7h 07m |
| 64 | 7h 02m | 7h 08m |
| 65 | 7h 02m | 7h 10m |
| 66 | 7h 04m | 7h 11m |
| 67 | 7h 04m | 7h 13m |
| 68 | 7h 02m | 7h 12m |
| 69 | 7h 01m | 7h 14m |
| 70 | 7h 01m | 7h 13m |
| 71 | 7h 01m | 7h 14m |
| 72 | 7h 00m | 7h 13m |
| 73 | 6h 59m | 7h 14m |
| 74 | 6h 58m | 7h 14m |
| 75 | 6h 58m | 7h 14m |
| 76 | 6h 59m | 7h 16m |
| 77 | 6h 58m | 7h 16m |
| 78 | 6h 59m | 7h 18m |
| 79 | 7h 00m | 7h 17m |
| 80 | 6h 58m | 7h 21m |
| 81 | 7h 01m | 7h 20m |
| 82 | 7h 00m | 7h 23m |
| 83 | 6h 57m | 7h 23m |
| 84 | 7h 04m | 7h 27m |
| 85 | 7h 02m | 7h 24m |
| 86 | 7h 03m | 7h 31m |
| 87 | 7h 05m | 7h 31m |
| 88 | 7h 13m | 7h 28m |
| 89 | 7h 19m | 7h 37m |
| 90 | 7h 34m | 7h 38m |
Percentage of participants that nap during the day by sex
| Female | Male | |
| Never/rarely | 63.91% | 56.28% |
| Sometimes | 31.09% | 35.36% |
| Usually | 4.69% | 7.89% |
| No Answer | 0.30% | 0.47% |
Percentage of participants that receive complaints about snoring by sex
| Complaints received? | Male | Female |
| No | 53.8% | 67.4% |
| Yes | 38.7% | 23.6% |
| NA | 7.5% | 9.0% |
Percentage of participants who receive snoring complaints (standardised by sex)
| Age in years | Receive complaints about snoring | Percentage (standardised by sex) |
| 18-29 | No | 77.12% |
| 18-29 | Yes | 22.88% |
| 30-39 | No | 70.64% |
| 30-39 | Yes | 29.36% |
| 40-49 | No | 64.13% |
| 40-49 | Yes | 35.87% |
| 50-59 | No | 59.77% |
| 50-59 | Yes | 40.23% |
| 60-69 | No | 62.20% |
| 60-69 | Yes | 37.80% |
| 70-79 | No | 70.79% |
| 70-79 | Yes | 29.21% |
| 80+ | No | 82.68% |
| 80+ | Yes | 17.32% |
Percentage of participants who nap by age group (standardised by sex)
| Percentage of participants (standardised by sex) | |||
| Age in years | Never/rarely | Sometimes | Usually |
| 18-29 | 63.61% | 31.02% | 5.38% |
| 30-39 | 67.27% | 28.94% | 3.78% |
| 40-49 | 66.21% | 29.61% | 4.18% |
| 50-59 | 63.48% | 31.68% | 4.84% |
| 60-69 | 59.12% | 34.47% | 6.41% |
| 70-79 | 51.20% | 38.81% | 9.98% |
| 80+ | 39.50% | 42.55% | 17.95% |
Note to researchers
Survey estimates are influenced by how participants are recruited, how questions are asked and how outcomes are defined and measured. As these methods vary between surveys, figures from Our Future Health and other sources should not be treated as directly comparable. Any differences should be interpreted with appropriate caution.
Our Future Health is the UK’s largest health research cohort and is designed to reflect the diversity of the UK population. One strength of Our Future Health is that the scale and breadth of recruitment provide unprecedented numbers of participants from communities historically under-represented in health research.
The participant cohort is susceptible to selection bias, so participation is not yet fully representative by age, sex, ethnicity, deprivation, and geography. However, our staged recruitment strategy is designed to address the imbalance as far as possible, and we are already more demographically representative than other cohorts such as the UK Biobank. We are developing sampling weights which will enable researchers to correct for ways in which our volunteer cohort remains unrepresentative of the general population.