Revealed: what our data tells us about our physical activity levels
Can you guess what percentage of Our Future Health participants regularly meet the government’s recommended guidelines for physical activity?
Before we tell you the answer, here’s a quick reminder of the guidelines. According to the UK Chief Medical Officers, people aged 18-64 should aim for:
- At least 150 minutes of moderate intensity activity a week – or 75 minutes of vigorous intensity activity a week.
- Muscle-strengthening activities on at least 2 days per week, targeting all major muscle groups
- Exercise to be spread evenly over 4 or more days a week
Over the age of 65, the guidelines are similar, with added emphasis on being active every day and doing activities that improve balance and flexibility.
So, what percentage of the population meets the recommended guidelines?
A bold new picture of physical activity
To answer the question, we looked at data from 1,929,744 participants who had completed their health and lifestyle questionnaire. The questionnaire asks a set of standard questions that are based on commonly used questionnaires for health research, to discover how much people are exercising – and how.
The sample size was significantly larger than other prominent surveys of physical activity in the UK.
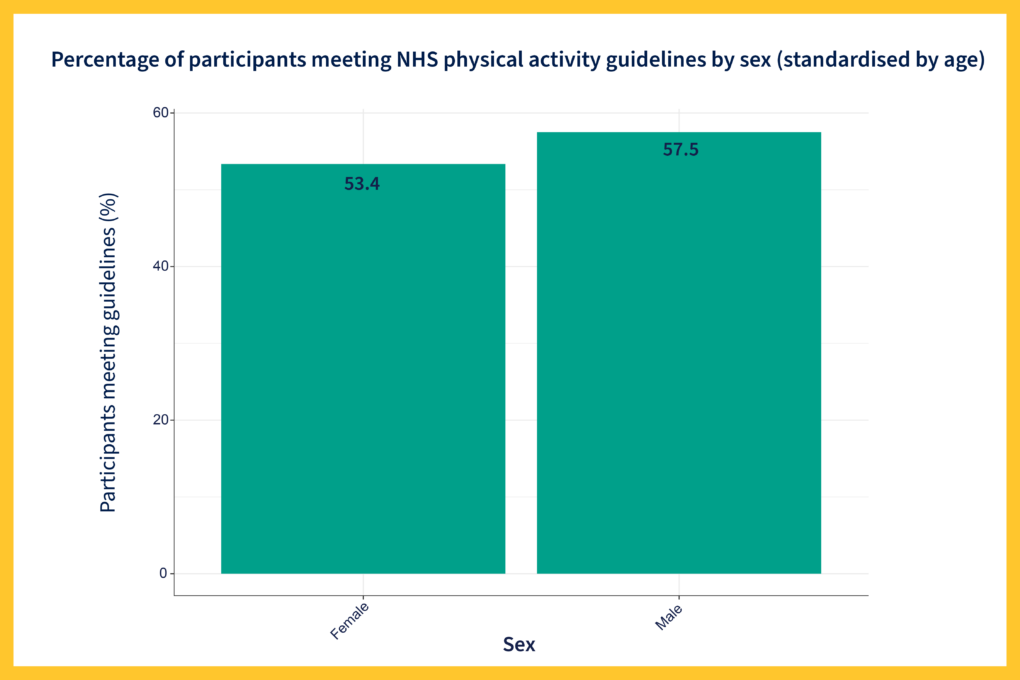
Our analysis revealed that 55.5% of Our Future Health participants meet current physical activity guidelines.
This breaks down as 57.5% of men and 53.4% of women.
The midlife exercise gap – and the battle of the sexes
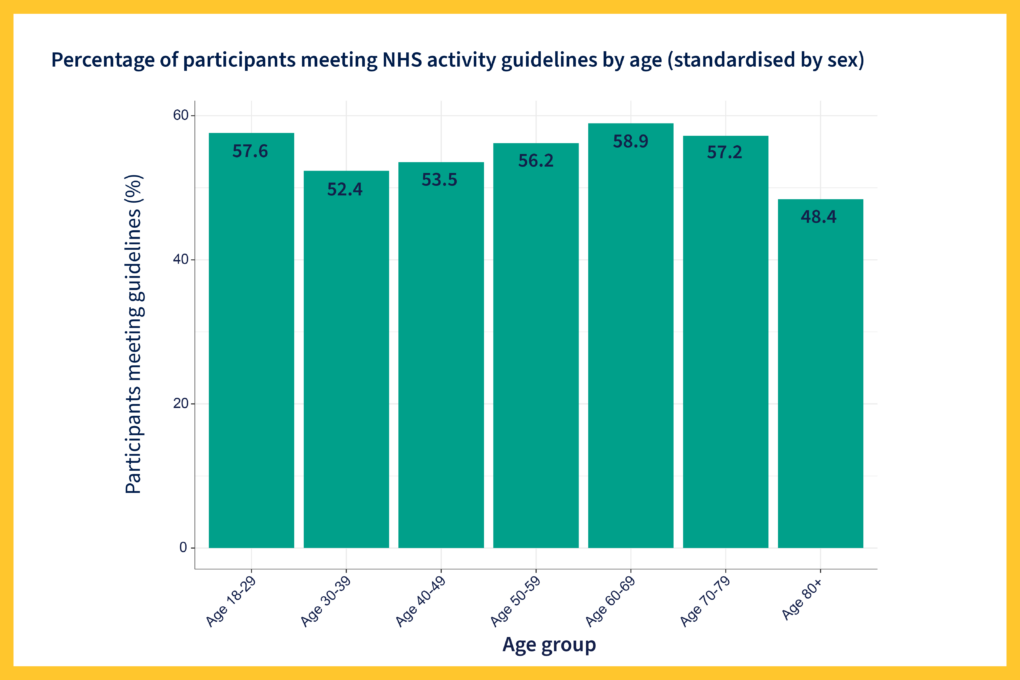
Contrary to previous surveys across England, Scotland and Wales, our analysis suggests that young adults are not the age group which can boast the highest percentage of participants meeting NHS guidelines. Instead, that accolade goes to 60-69 year olds (57.6% vs 58.9%).
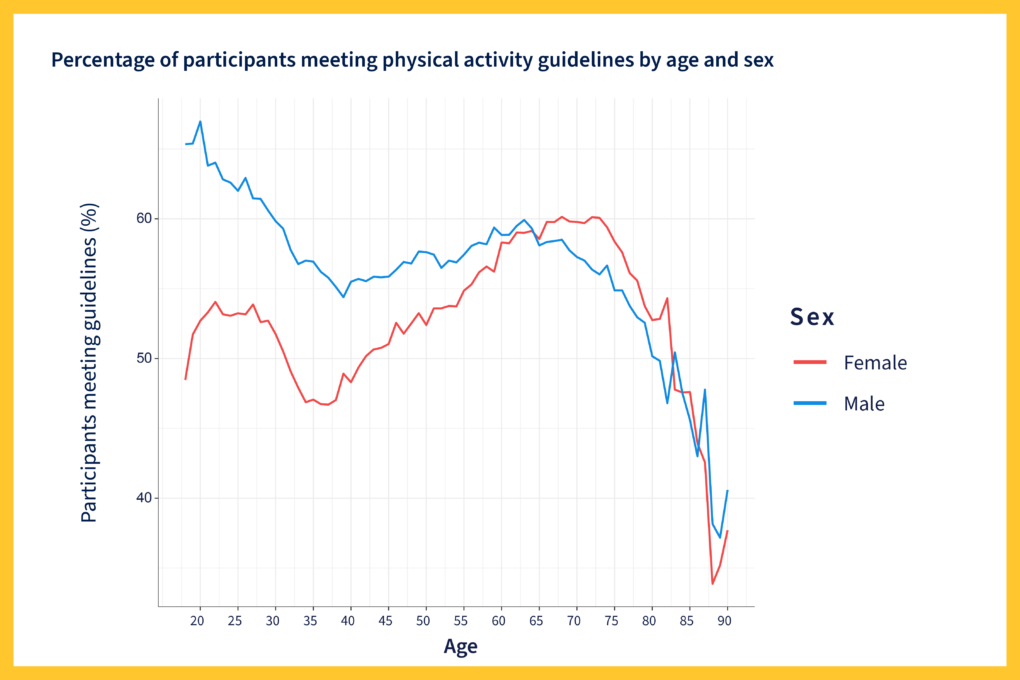
If we split the data by sex, a more nuanced picture starts to emerge. While both men and women appear to suffer from a ‘midlife exercise gap’ between the ages of roughly 30 and 50, women are currently more likely to meet the recommended guidelines after midlife. They overtake men around retirement age – also getting more exercise than women aged 18-29 at this point.
Our participants’ data also reveals the different types of exercise undertaken by each age group.
According to NHS guidelines, physical activity can be categorised as moderate or vigorous. Moderate activity is exercise where you can talk but not sing, such as riding a bike or hiking. Vigorous activity makes you breathe hard and fast, like running or aerobics.
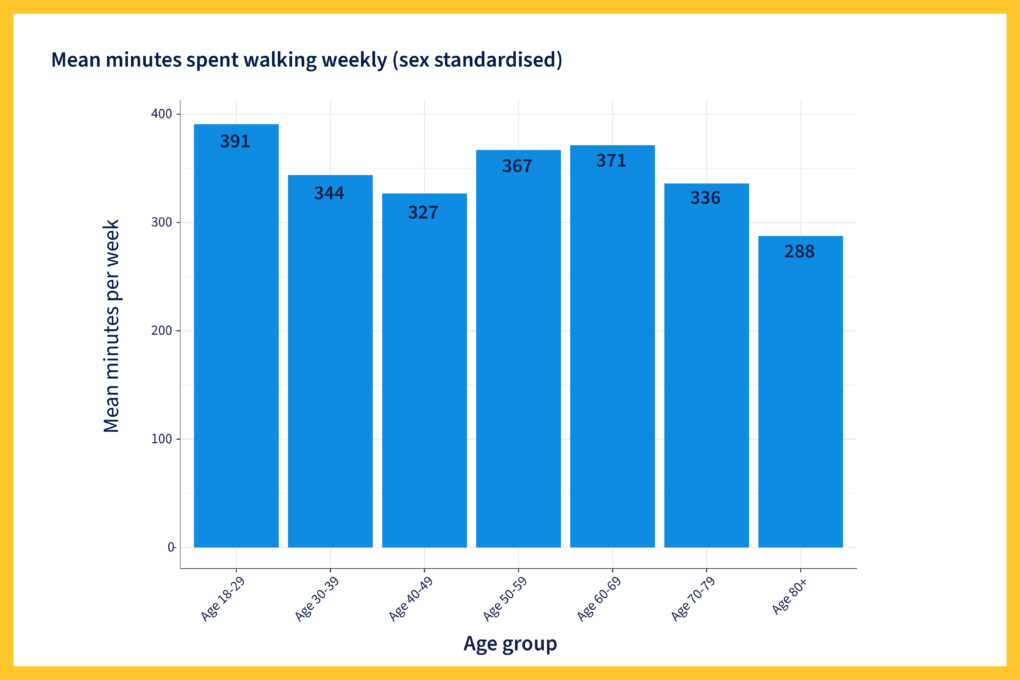
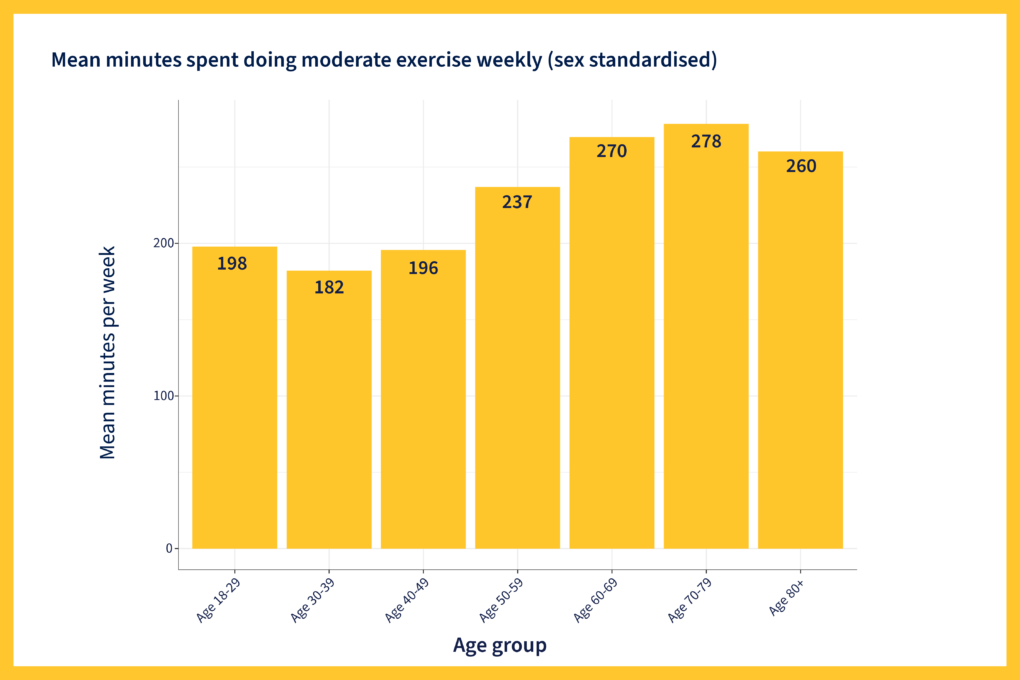
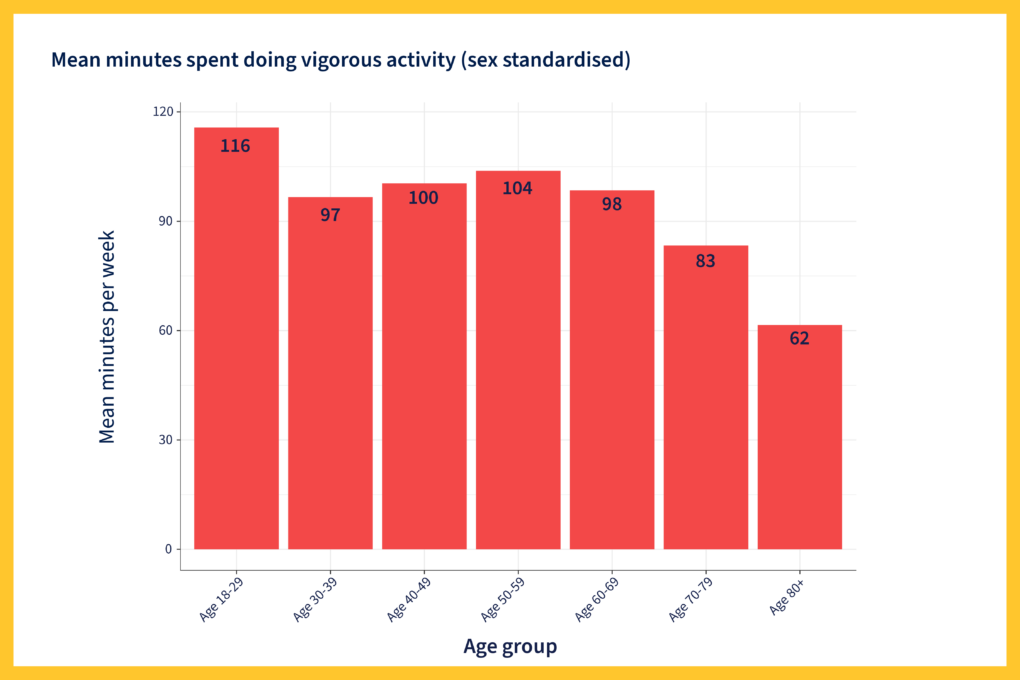
Our data shows that while younger people do more walking and more vigorous exercise, 70-79 year-olds do the most moderate exercise.
For example, people aged 18-29 spent an average of 391 minutes a week walking – the most of any age group. People aged 80 and over spend an average of 288 minutes walking a week.
However, people in the youngest age group complete an average of 198 minutes of moderate exercise a week, while people in the oldest age group complete an average of 260 minutes.
The local view
Our analysis plotted activity levels by area, to highlight the most – and least – active areas of the UK.
Overall, adults who live in South West England were most likely (57.3%) to hit their weekly recommended physical activity levels. In contrast, only 52.4% in the West Midlands hit their levels – the lowest of all the areas analysed.
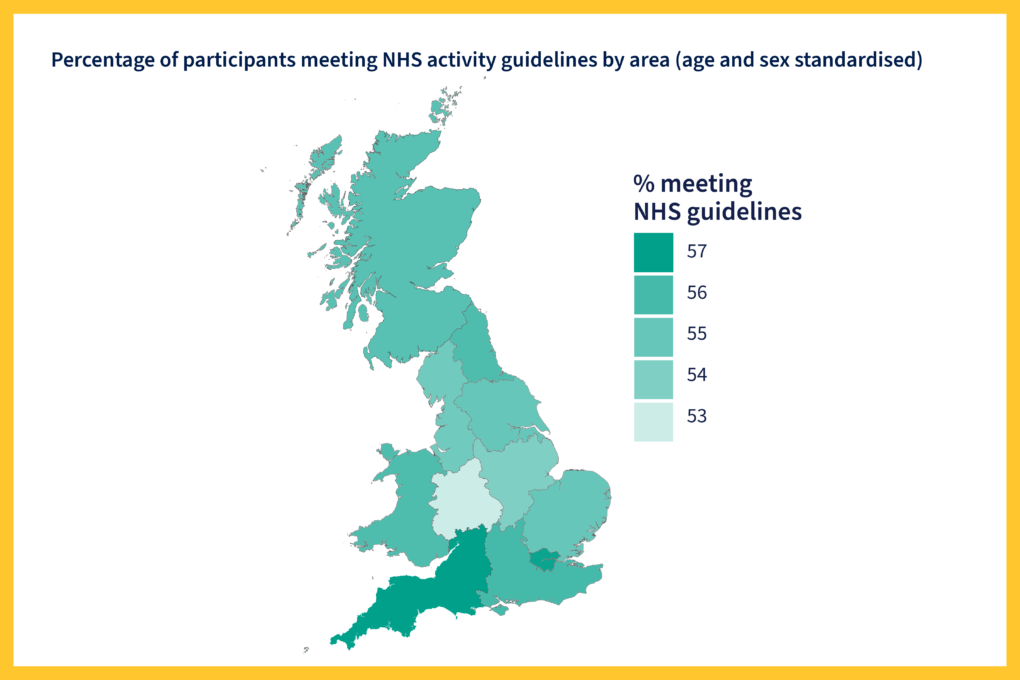
When we look at type of activity, we see that people living in Scotland and North East England do the most walking, while those in South West England and the East Midlands do the most moderate exercise.
Overall, people living in rural areas outperform those in urban ones.
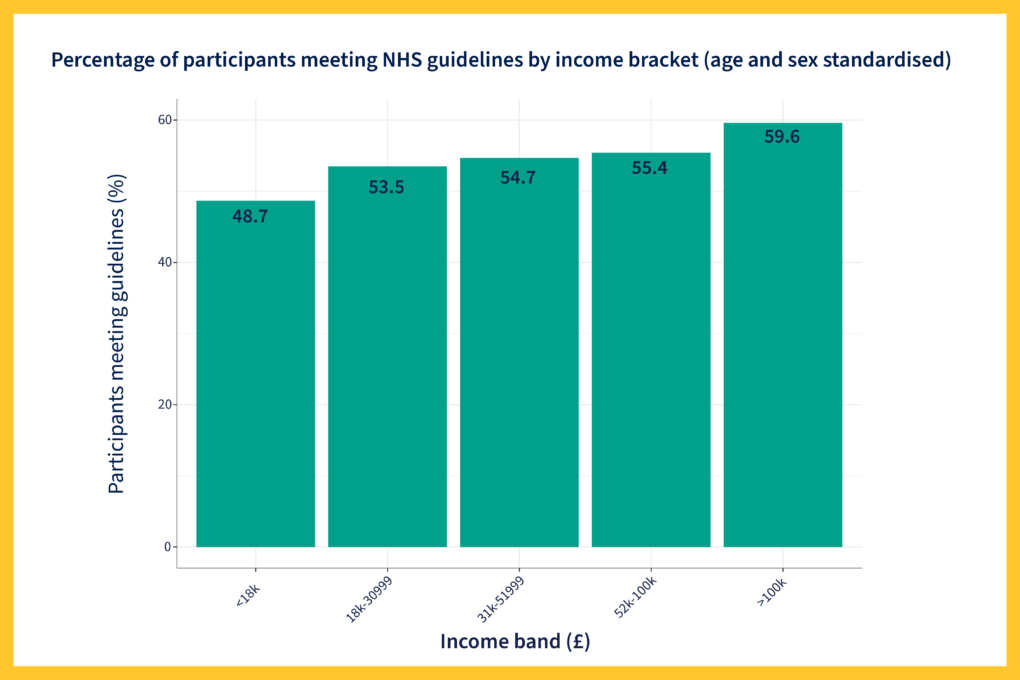
The amount of physical activity undertaken also varies by income levels. Overall, the percentage of participants meeting the NHS guidelines for physical activity increases with income.
Physical activity data tables
The following tables display data from our analysis of 1,929,744 questionnaires. The data was used to create the graphs that you can see in this article.
Percentage of participants meeting physical activity guidelines by sex (standardised by age)
| Sex | Percentage meeting guidelines |
| Female | 53.4 |
| Male | 57.5 |
Percentage of participants meeting physical activity guidelines by age (standardised by sex)
| Age | Percentage meeting guidelines |
| 18-29 | 57.6 |
| 30-39 | 52.4 |
| 40-49 | 53.5 |
| 50-59 | 56.2 |
| 60-69 | 58.9 |
| 70-79 | 57.2 |
| 80+ | 48.4 |
Mean minutes spent walking weekly (standardised by sex)
| Age | Minutes |
| 18-29 | 391 |
| 30-39 | 344 |
| 40-49 | 327 |
| 50-59 | 367 |
| 60-69 | 371 |
| 70-79 | 336 |
| 80+ | 288 |
Mean minutes spent doing moderate exercise weekly (standardised by sex)
| Age | Minutes |
| 18-29 | 198 |
| 30-39 | 182 |
| 40-49 | 196 |
| 50-59 | 237 |
| 60-69 | 270 |
| 70-79 | 278 |
| 80+ | 260 |
Mean minutes spent doing vigorous activity (standardised by sex)
| Age | Minutes |
| 18-29 | 116 |
| 30-39 | 97 |
| 40-49 | 100 |
| 50-59 | 104 |
| 60-69 | 98 |
| 70-79 | 83 |
| 80+ | 62 |
Percentage of participants meeting NHS guidelines by geographic area (age and sex standardised)
| Geographic area | Percentage |
| East | 54.9 |
| East Midlands | 54.3 |
| London | 57.1 |
| North East | 55.4 |
| North West | 54.6 |
| Scotland | 55.2 |
| South East | 55.7 |
| South West | 57.3 |
| Wales | 55.4 |
| West Midlands | 52.4 |
| Yorkshire and the Humber | 54.8 |
Percentage of participants meeting NHS guidelines by income bracket (age and sex standardised)
| Annual income | Percentage |
| Less than £18,000 | 48.7 |
| £18,000 – £30,999 | 53.5 |
| £31,000 – £51,999 | 54.7 |
| £52,000 – £100,000 | 55.4 |
| More than £100,000 | 59.6 |
Percentage of participants meeting NHS guidelines by age and sex
| Age | Female (%) | Male (%) |
| 18 | 48.5 | 65.3 |
| 19 | 51.7 | 65.4 |
| 20 | 52.7 | 67.0 |
| 21 | 53.3 | 63.8 |
| 22 | 54.1 | 64.0 |
| 23 | 53.2 | 62.8 |
| 24 | 53.1 | 62.6 |
| 25 | 53.2 | 62.0 |
| 26 | 53.2 | 62.9 |
| 27 | 53.9 | 61.5 |
| 28 | 52.6 | 61.4 |
| 29 | 52.7 | 60.6 |
| 30 | 51.7 | 59.8 |
| 31 | 50.5 | 59.3 |
| 32 | 49.1 | 57.8 |
| 33 | 47.9 | 56.8 |
| 34 | 46.9 | 57.0 |
| 35 | 47.1 | 56.9 |
| 36 | 46.7 | 56.2 |
| 37 | 46.7 | 55.8 |
| 38 | 47.0 | 55.1 |
| 39 | 48.9 | 54.4 |
| 40 | 48.3 | 55.5 |
| 41 | 49.4 | 55.7 |
| 42 | 50.2 | 55.5 |
| 43 | 50.6 | 55.9 |
| 44 | 50.8 | 55.8 |
| 45 | 51.0 | 55.9 |
| 46 | 52.6 | 56.4 |
| 47 | 51.8 | 56.9 |
| 48 | 52.5 | 56.8 |
| 49 | 53.2 | 57.7 |
| 50 | 52.4 | 57.6 |
| 51 | 53.6 | 57.4 |
| 52 | 53.6 | 56.5 |
| 53 | 53.8 | 57.0 |
| 54 | 53.7 | 56.9 |
| 55 | 54.9 | 57.4 |
| 56 | 55.3 | 58.1 |
| 57 | 56.2 | 58.3 |
| 58 | 56.6 | 58.2 |
| 59 | 56.2 | 59.4 |
| 60 | 58.3 | 58.8 |
| 61 | 58.3 | 58.9 |
| 62 | 59.0 | 59.5 |
| 63 | 59.0 | 59.9 |
| 64 | 59.1 | 59.3 |
| 65 | 58.6 | 58.1 |
| 66 | 59.8 | 58.3 |
| 67 | 59.8 | 58.4 |
| 68 | 60.1 | 58.5 |
| 69 | 59.8 | 57.7 |
| 70 | 59.8 | 57.3 |
| 71 | 59.7 | 57.0 |
| 72 | 60.1 | 56.4 |
| 73 | 60.1 | 56.0 |
| 74 | 59.4 | 56.7 |
| 75 | 58.4 | 54.9 |
| 76 | 57.6 | 54.9 |
| 77 | 56.1 | 53.8 |
| 78 | 55.6 | 53.0 |
| 79 | 53.8 | 52.6 |
| 80 | 52.8 | 50.2 |
| 81 | 52.8 | 49.8 |
| 82 | 54.3 | 46.8 |
| 83 | 47.8 | 50.4 |
| 84 | 47.6 | 47.5 |
| 85 | 47.6 | 45.6 |
| 86 | 43.9 | 43.0 |
| 87 | 42.6 | 47.8 |
| 88 | 33.9 | 38.2 |
| 89 | 35.2 | 37.2 |
| 90 | 37.7 | 40.6 |