How much do we drink? Analysing our data on alcohol
How often, and how much, do you drink?
Thanks to new analysis of our data, you can compare your drinking habits against those of Our Future Health participants of a similar age, sex and income level.
We’ve analysed data from almost 1.7 million participants – the largest survey of alcohol intake ever carried out in the UK.
It reveals the age groups that are most likely to be teetotal, and the income levels where risk-associated drinking is at its highest.
The guidelines
UK health guidance sets out how to keep the risks from drinking alcohol low.
The UK Chief Medical Officers advise that:
- No level of alcohol consumption improves health.
- Adults shouldn’t regularly drink more than 14 units of alcohol a week.
- If you regularly drink as much as 14 units per week, it’s best to spread your drinking evenly over 3 or more days.
Alcohol consumption is commonly grouped into 3 categories:
- Lower risk. Up to 14 units a week.
- Increasing risk. Between 15-34 units for women, and 15-49 units for men.
- Higher risk. Regularly drinking more than 35 units a week for women, and more than 50 for men.
According to guidelines, one unit of alcohol is a half pint of regular beer or cider, or half a small glass of wine, or a single measure of spirits.
Digging into the data
We analysed data from 1,658,167 Our Future Health participants who had completed their health and lifestyle questionnaire. The questionnaire is an important step to taking part in our programme. It asks a series of questions, including questions about alcohol consumption.
Overall, 78.7% of our participants reported that they stick to the guidelines, by drinking 14 or fewer units a week. That means roughly 1 in 5 are drinking at increasing or higher risk.
The picture becomes more nuanced when you sort the data into categories.
For example, our analysis shows a significant variation between men and women. 87.4% of women are lower risk drinkers, compared with just 72% of men.
According to our standardised figures, women are also more likely to never drink alcohol than men. 11.4% of women reported that they’re teetotal, compared with 9.8% of men.
Younger generations are drinking less
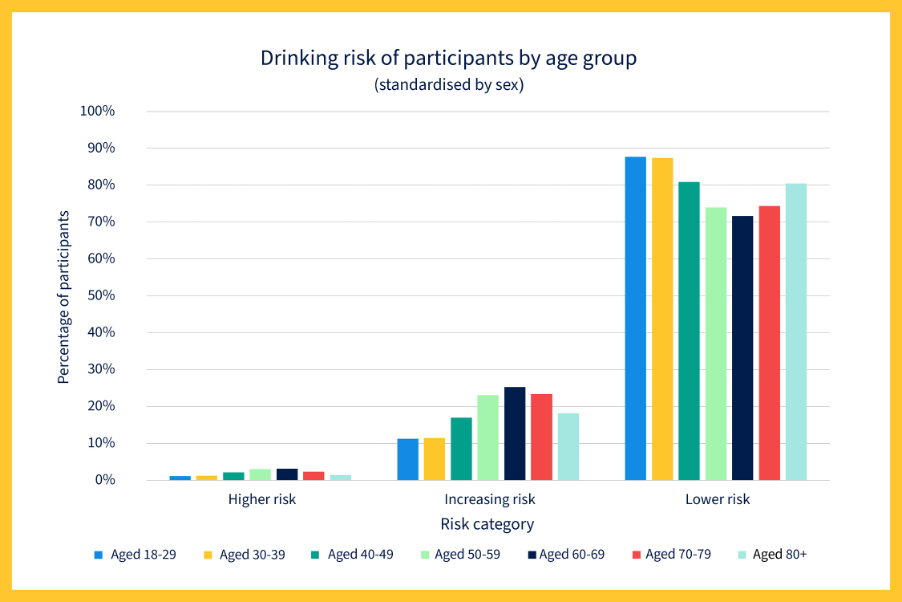
According to our data, there is a marked difference in drinking habits across different age groups.
87.7% of people aged 18-29 years old are lower risk drinkers – the highest proportion of any age group. Similarly, 87.4% of people aged 30-39 report drinking at a lower risk.
The data highlights a ‘jump’ among 40-49 year-olds, of whom 80.8% drink 14 units or less.
60-69-year-olds are most likely to drink over 14 units a week. Only 71.7% fall into the lower risk category. That means 28.3% of 60-69 year olds exceed the lower risk drinking guidelines, versus 12.4% of 18-29 year olds.
Above the age of 69, the percentage of people who report either increasing or higher risk drinking starts to fall. However, it remains higher than for people under the age of 40.
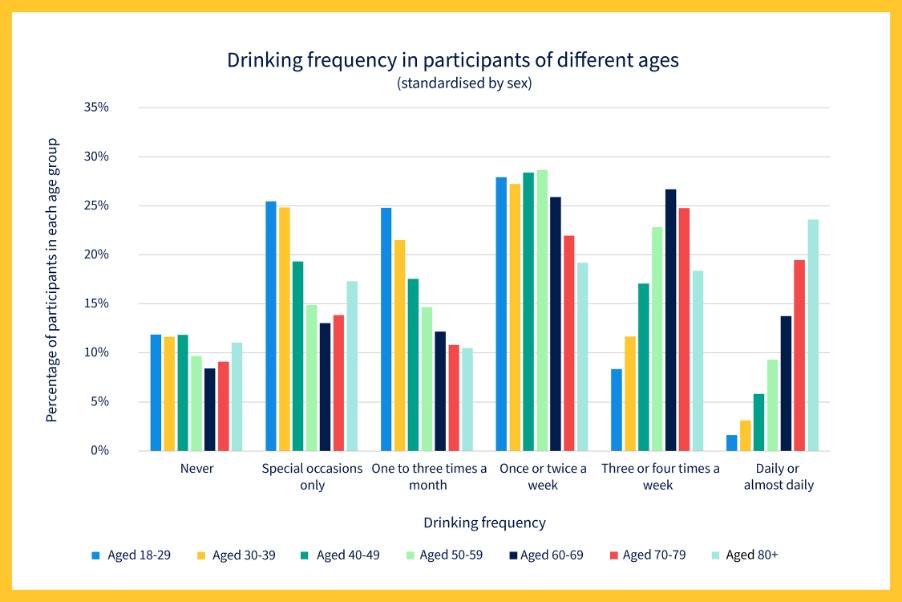
We can see a similar pattern of youthful temperance in the frequency of drinking across the age groups.
Younger people are more likely to be teetotal, while the oldest generation is most likely to drink every day.
11.9% of 18-29-year-olds are teetotal, while only 1.6% drink daily. Comparatively, 23.6% of people aged 80 and over drink daily – the highest proportion of any age group – and 11.0% are teetotal.
60–69-year-olds are the least likely to be teetotal, at 8.4%.
The more you earn, the more you drink
Our analysis also showed interesting patterns in alcohol habits across different income levels.
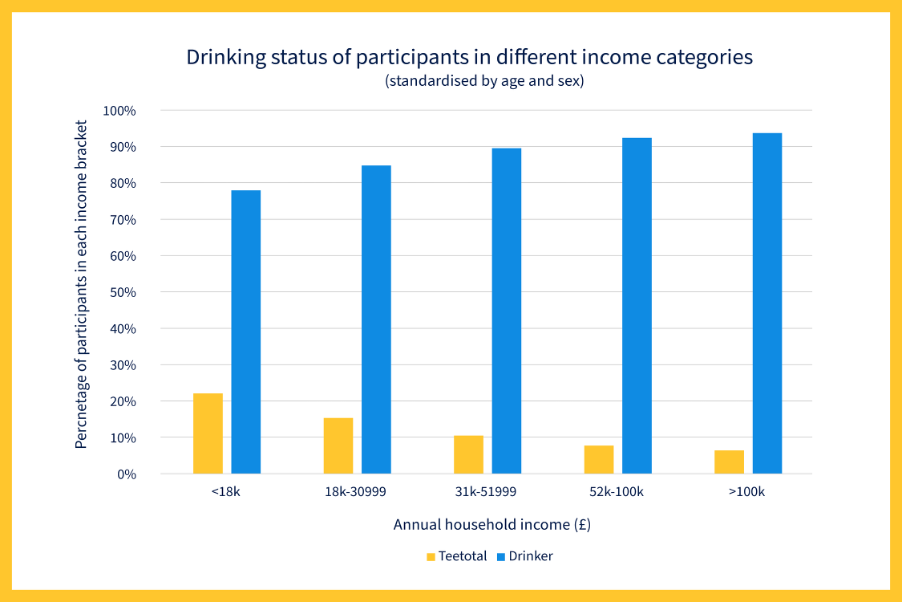
According to data from our participants, the proportion of people who drink alcohol increases with household income (see the graph at the top of this page). 77.9% of people from households that earn up to £18,000 a year drink alcohol, compared with 93.7% of people from households that earn over £100,000.
Similarly, risky drinking increases in line with increased income. 15.3% of people from households that earn under £18,000 a year report drinking over 14 units a week. The proportion then steadily rises through each income bracket, until it reaches 25.7% of people from households earning over £100,000.
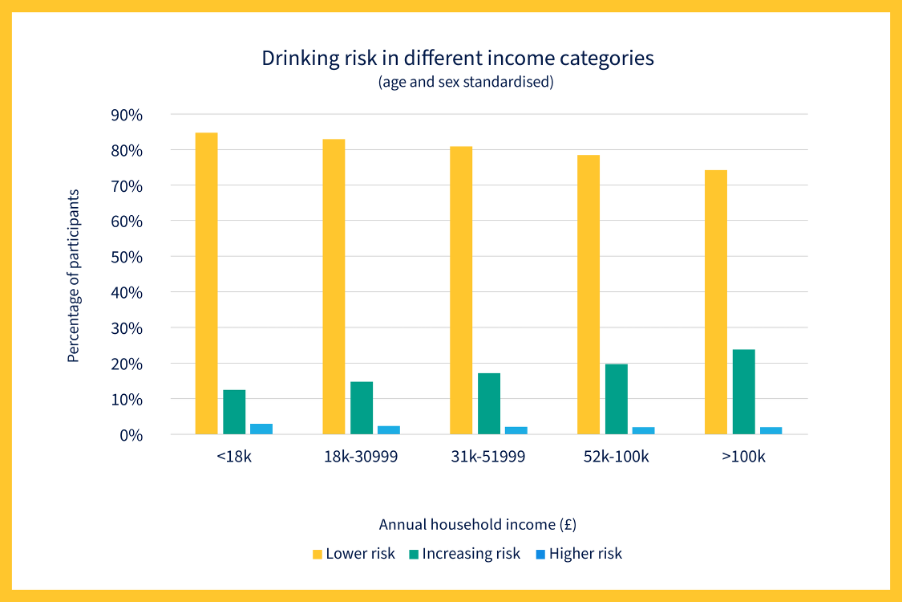
Previous research shows that harm from alcohol varies across socioeconomic groups, even for similar levels of consumption.
We also looked at how the data breaks down across different ethnicities and regions. You can see the results in the data tables at the bottom of this article.
‘The tip of the iceberg for alcohol research’
Ros Blackwood is Our Future Health’s Director of Population Health and a senior visiting researcher in the alcohol team at King’s College London.
“Our Future Health is a fantastic resource to support research on alcohol and health,” she says. “The data we’re sharing gives us insights into alcohol by age, sex and income at a scale that hasn’t yet been possible in health research.
“For alcohol researchers like me, it’s the tip of the iceberg. Our participants share an extraordinary level of detail about their health, including their genetic information, health records, and clinic measurements.
“Taken together, it can be used by researchers to further our knowledge on alcohol consumption and delve deeper into risks, protective factors, longer-term health impacts of alcohol and inequalities.”
Data tables
Average weekly alcohol consumption in units, by age group (standardised by sex):
| Age group | Units of alcohol per week | |||||
| <=7 | 7-14 | 14-21 | 21-35 | 35-50 | >50 | |
| 18-29 | 71.9% | 15.7% | 6.3% | 4.2% | 1.0% | 0.8% |
| 30-39 | 71.5% | 16.0% | 6.4% | 4.1% | 1.2% | 0.9% |
| 40-49 | 62.2% | 18.6% | 9.0% | 6.5% | 2.1% | 1.6% |
| 50-59 | 53.4% | 20.6% | 11.6% | 9.1% | 3.2% | 2.1% |
| 60-69 | 49.8% | 21.9% | 12.4% | 10.0% | 3.6% | 2.2% |
| 70-79 | 52.2% | 22.2% | 11.7% | 9.2% | 3.1% | 1.6% |
| 80+ | 59.0% | 21.4% | 9.5% | 7.0% | 2.0% | 1.0% |
Average drinking frequency by age group (standardised by sex):
| Age group | |||||||
| Frequency of drinking | 18-29 | 30-39 | 40-49 | 50-59 | 60-69 | 70-79 | 80+ |
| Never | 11.9% | 11.6% | 11.8% | 9.7% | 8.4% | 9.1% | 11.0% |
| Special occasions only | 25.4% | 24.8% | 19.3% | 14.9% | 13.0% | 13.8% | 17.3% |
| One to three times a month | 24.8% | 21.5% | 17.6% | 14.7% | 12.2% | 10.8% | 10.5% |
| Once or twice a week | 27.9% | 27.2% | 28.4% | 28.7% | 25.9% | 22.0% | 19.2% |
| Three or four times a week | 8.4% | 11.7% | 17.1% | 22.8% | 26.7% | 24.8% | 18.4% |
| Daily or almost daily | 1.6% | 3.1% | 5.8% | 9.3% | 13.78% | 19.5% | 23.6% |
Percentage of participants who drink alcohol, by age group (standardised by sex):
| Age group | Percentage who drink alcohol | Percentage who are teetotal |
| 18-29 | 88.1% | 11.9% |
| 30-39 | 88.4% | 11.6% |
| 40-49 | 88.2% | 11.8% |
| 50-59 | 90.3% | 9.7% |
| 60-69 | 91.6% | 8.4% |
| 70-79 | 90.9% | 9.1% |
| 80+ | 89.0% | 11.0% |
Percentage of participants who drink alcohol, by ethnicity
| Ethnicity | Percentage who drink alcohol | Percentage who are teetotal | Percentage who prefer not to answer |
| White British | 91.8% | 7.9% | 0.2% |
| White Other | 89.8% | 9.7% | 0.5% |
| Mixed | 87.0% | 12.5% | 0.5% |
| Black Caribbean | 86.3% | 13.0% | 0.7% |
| Other Asian | 75.6% | 23.9% | 0.5% |
| Indian | 68.0% | 31.0% | 0.9% |
| Other | 67.6% | 31.1% | 1.2% |
| Black Other | 65.4% | 33.6% | 1.0% |
| Black African | 64.3% | 34.8% | 0.9% |
| Bangladeshi | 20.5% | 77.6% | 1.8% |
| Pakistani | 14.3% | 84.2% | 1.6% |
Drinking risk by age group (standardised by sex):
| Age group | Percentage who drink at higher risk | Percentage who drink at increasing risk | Percentage who drink at lower risk |
| 18-29 | 1.1% | 11.3% | 87.7% |
| 30-39 | 1.2% | 11.4% | 87.4% |
| 40-49 | 2.1% | 17.0% | 80.9% |
| 50-59 | 3.0% | 23.0% | 74.0% |
| 60-69 | 3.1% | 25.2% | 71.7% |
| 70-79 | 2.3% | 23.3% | 74.4% |
| 80+ | 1.4% | 18.1% | 80.5% |
Drinking risk by sex (standardised by age)
| Sex | Percentage who drink at higher risk | Percentage who drink at increasing risk | Percentage who drink at lower risk |
| Female | 1.7% | 10.9% | 87.4% |
| Male | 2.3% | 25.4% | 72.3% |
Percentage of participants who drink alcohol, by income (standardised by age and sex)
| Income (per year) | Percentage who drink alcohol | Percentage who are teetotal |
| <£18,000 | 77.9% | 22.1% |
| £18,000 – £30,999 | 84.7% | 15.3% |
| £31,000 – £51,999 | 89.5% | 10.5% |
| £52,000 – £100,000 | 92.3% | 7.7% |
| >£100,000 | 93.6% | 6.4% |
Drinking risk by income (standardised by age and sex)
| Income | Percentage who drink at higher risk | Percentage who drink at increasing risk | Percentage who drink at lower risk |
| <£18,000 | 2.9% | 12.4% | 84.7% |
| £18,000 – £30,999 | 2.3% | 14.8% | 82.9% |
| £31,000 – £51,999 | 2.0% | 17.1% | 80.8% |
| £52,000 – £100,000 | 2.0% | 19.7% | 78.4% |
| >£100,000 | 2.0% | 23.8% | 74.3% |
Drinking risk by location (standardised by age and sex)
| Region | Percentage who drink at higher risk | Percentage who drink at increasing risk | Percentage who drink at lower risk |
| East (England) | 1.7% | 15.5% | 82.8% |
| East Midlands (England) | 2.0% | 16.9% | 81.1% |
| London | 2.0% | 19.5% | 78.4% |
| North East (England) | 2.3% | 18.7% | 79.0% |
| North West (England) | 2.4% | 19.5% | 78.2% |
| Northern Ireland | 1.9% | 16.5% | 81.6% |
| Scotland | 1.9% | 17.1% | 81.0% |
| South East (England) | 1.8% | 17.2% | 81.0% |
| South West (England) | 1.8% | 17.3% | 81.0% |
| Wales | 2.1% | 16.6% | 81.3% |
| West Midlands (England) | 2.1% | 17.0% | 81.0% |
| Yorkshire and the Humber | 2.3% | 19.0% | 78.7% |